Anyone can learn and become a data analytics professional. However, here are some prerequisites that would be helpful for choosing a career in data analytics: Ability to work with numbers and quantitative stuff Some programming experience Willingness to learn statistical concepts Passion for solving problems
Basic computer literacy
Access to a laptop or PC with internet connectivity
A willingness to learn and think critically with data
If you plan to switch to being a data analyst but bear no experience in the industry, this data analytics tutorial will provide you with a strong foundation in the subject.
Welcome to this course.
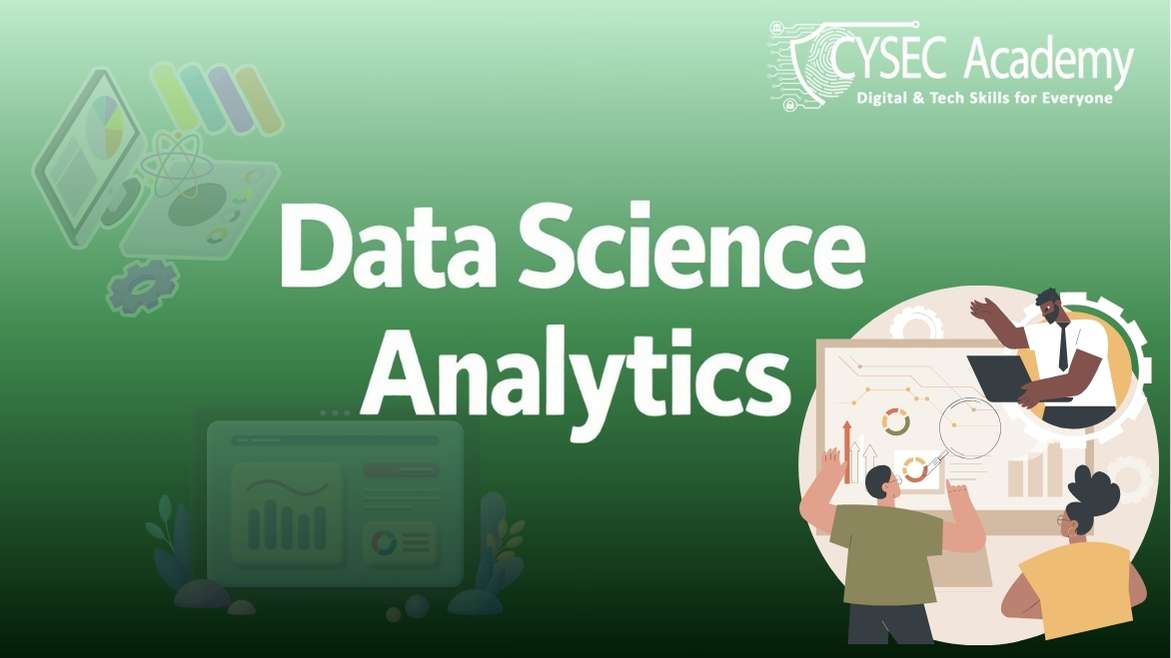
Data is every detail of our very existence. Conciously or not, we all contribute to global data and this data is relevant to different oganisations, in different forms to aid important decision making processess. Data analytics is the science of analyzing data and extracting meaningful information that can be used to make better decisions in an organization. This is something we all start doing from an early age. Analytics will help demystify data so you can use it to make informed decisions, recognize trends, detect outliers, and summarize data sets to inform business decisions.
Everything we do involves systems and processes. We buy and sell things; we eat, we travel, we watch TV, we surf the internet, we listen to music. With all this activity taking place, global businesses are drowning in data and they increasingly rely on people with good analytics skills to inform organizational decision-making. Overtime, the importance of data analytics have risen and this has led to the demand for analytical skills.
It’s the data analyst’s job to translate the data into actionable — and profitable — business intelligence.
Go above and beyond your peers by gaining the skill packed in this course.
By the end of this course learners will be able to
Understand the role and value of data science and analytics in modern industries
Define and describe the data analysis lifecycle
Identify common data types and sources
Apply basic statistical concepts such as mean median mode and standard deviation
Create and interpret simple data visualizations like charts graphs tables
Recognize the difference between descriptive predictive and prescriptive analytics
Use analytical thinking to approach real world problems
Prepare for more advanced learning in data science analytics or related fields
Module 1 Lesson 1
Module 1 Summary
Module 1
Module 2 Lesson 1
Module 3 Lesson 1
Module 3 Lesson 2
Module 3
Module 4 Lesson 1
Module 4 Lesson 2
Module 4 Lesson 3
Module 4
Module 5 Lesson 1
Module 5 Lesson 2
Module 5
Module 6 Lesson 1
Module 6 Lesson 2
Module 6
Module 7 Lesson 1
Module 7 Lesson 2
Module 7
Module 8 Lesson 1
Module 8 Lesson 2
Module 8 Lesson 3
Module 8 Lesson 4
Module 8
Lorem Ipsum is simply dummy text of the printing and typesetting industry. Lorem Ipsum has been the industry's standard dummy text ever since the 1500s, when an unknown printer took a galley of type and scrambled it to make a type specimen book. It has survived not only five centuries, but also the leap into electronic typesetting, remaining essentially unchanged. It was popularised in the 1960s with the release of Letraset sheets containing Lorem Ipsum passages, and more recently with desktop publishing software like Aldus PageMaker including versions of Lorem Ipsum.
No Review found